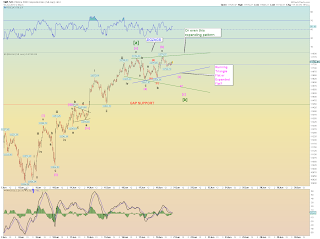
[Update 9:55PM: I'm glad Apple made a new high and resolved the triangle. I never liked how I scrunched a bunch of 3's and 4's together in the September-October region on my old chart. The new chart looks more naturally extended and more evenly spaced.
So how high for Apple? Hrmm. I suppose whenever Minor 2 tops out Apple should about the same time.
Also note the small red (1) could be about equal in visual length to red (5).
[Update 7:12PM: Here are the other charts I am monitoring to help set a Minor wave 2 target. None of these have met my target areas (except the VIX). But they are growing closer.
The real problem is the dollar. Is it in an Intermediate wave correction (2)? I tend to think it must be. It would be good to clear out the dollar bulls prior to any big equity market move Minor 3 crash.
I can imagine a sharp zigzag head and shoulders pattern play out perhaps. The dollar C wave down can happen fast and would likely align with an equity [c] wave up. Thats a best guess and so far it has panned out since I suggested the dollar was topping https://blogger.googleusercontent.com/img/b/R29vZ2xl/AVvXsEgooYE7Xc7noaPWLS90tJAUDrcJodNUSybpK78CVPv9Sq_6lkDQcmF1gg8obo00sQnXDQjoCwCgGftlw91f38LwWd8EfOXQusYE22CRy0C8ve0Y_9sZJ24kPFhxF8ddVf4tLUPNhmAp8dU/s1600/dollar.png
Technically, the Ultimate Oscillator on the dollar is getting low and it has turned when it gets that low and the RSI is near horizontal support. So it may be ready for B up
The CPC is always useful to keep an eye on. It should probably move lower. Guessing the target box again based on Minor 2 of P[1]. I find this a somewhat more useful than stand-alone CPCE. I keep an eye on that too.
The BPSPX is behaving as I suggested it would for Minor 2. Again my target box lies a bit higher.
The cumulative advancer chart would still look good with a quick (c) of [b] wave down early next week, probably Monday. But it doesn't have to be. The problem is I wouldn't want to see it make new highs outright. But then again, maybe we get divergence in this.
After all, the weekly accumulative https://blogger.googleusercontent.com/img/b/R29vZ2xl/AVvXsEgJuzQDBeAsICDDPDO_q5Zc44jT96SPsIoxLLzwtl8tynnsg5zWs3XXUglXZIh0AaVyVK61jWDITl6xw-G0LNaCqsCpQO8WAIQrpyzg9mNivsE5j8kXTCHqGHk8Q8w0D9X611gf35ejboc/s1600/advancers1.png has broken out to new highs for quite some time now, yet obviously market prices have not followed to a new high and are miles from doing so. So that defies the typical "new-cumulative-highs-leads-the-market" theory. Its total bunk using weekly at least. But, we'll keep an eye on this. I'm looking for form more than anything.
[Update 5:55PM: Looking for an A wave low on the dollar and a B wave retrace. Its approaching the Fib 23.6% retracement and it has a falling wedge shape. I am guessing B wave strength up in the dollar may help translate into [b] wave weakness down in equities, at least a bit. ]
Monday should be interesting day after OPEX quad witching Friday which was rather tame. We can speculate on which way the squiggles will break all weekend.
The 10 minute Wilshire suggests a lot of corrective type waves, mainly zigzags that are combining to form some kind of Minute [b] wave pattern. Hey maybe [a] is not over with yet. I won't argue, but it just feels like a [b] so I'll stick with it for now.
Lots of potential ways for the waves to break come Monday. Considering today was quad witching and maybe they spent some money keeping the bid up, I lean toward the downside Monday. But like I said, I won't be looking at 1 minute squiggles too much this weekend, my eyes are straining...gah
The bottom line is we have a primary count Minor-sized wave 2 that has yet to even hit its 50% retrace (1130SPX) let alone higher.
Bottom line: it doesn't yet look as a completed [b] wave pattern. Triangle or expanded flat is a best guess for now.
I still don't see a solid [b] using just daily candles. Also note the 4 closing days above the 19:1 candle. This is what I was saying. If it can do that, and use that candle as support, it can go higher once its consolidates enough. Question is has it consolidated enough? I don't yet see a completed [b] wave pattern.I cannot blame the market for the tight, "calm" days of late. Look at this Wilshire chart and it is just riddled with huge moves.
VIX is getting short term oversold on the hourly chart (not shown). Should have some support somewhere in here. I will say this: It hit my target area and has a clear [a][b][c] wave structure down from its peak.
Bottom line is we have to be patient until the waves clear up a bit and give us a better squiggle count. Now that OPEX is over, we cannot use that as a crutch anymore for the moment.We'll check out other indicators later (BPSPXm CPC, Dollar, etc) and see how things align.


No Response to "Elliott Wave Update 18 June Update 9:55PM"
Post a Comment